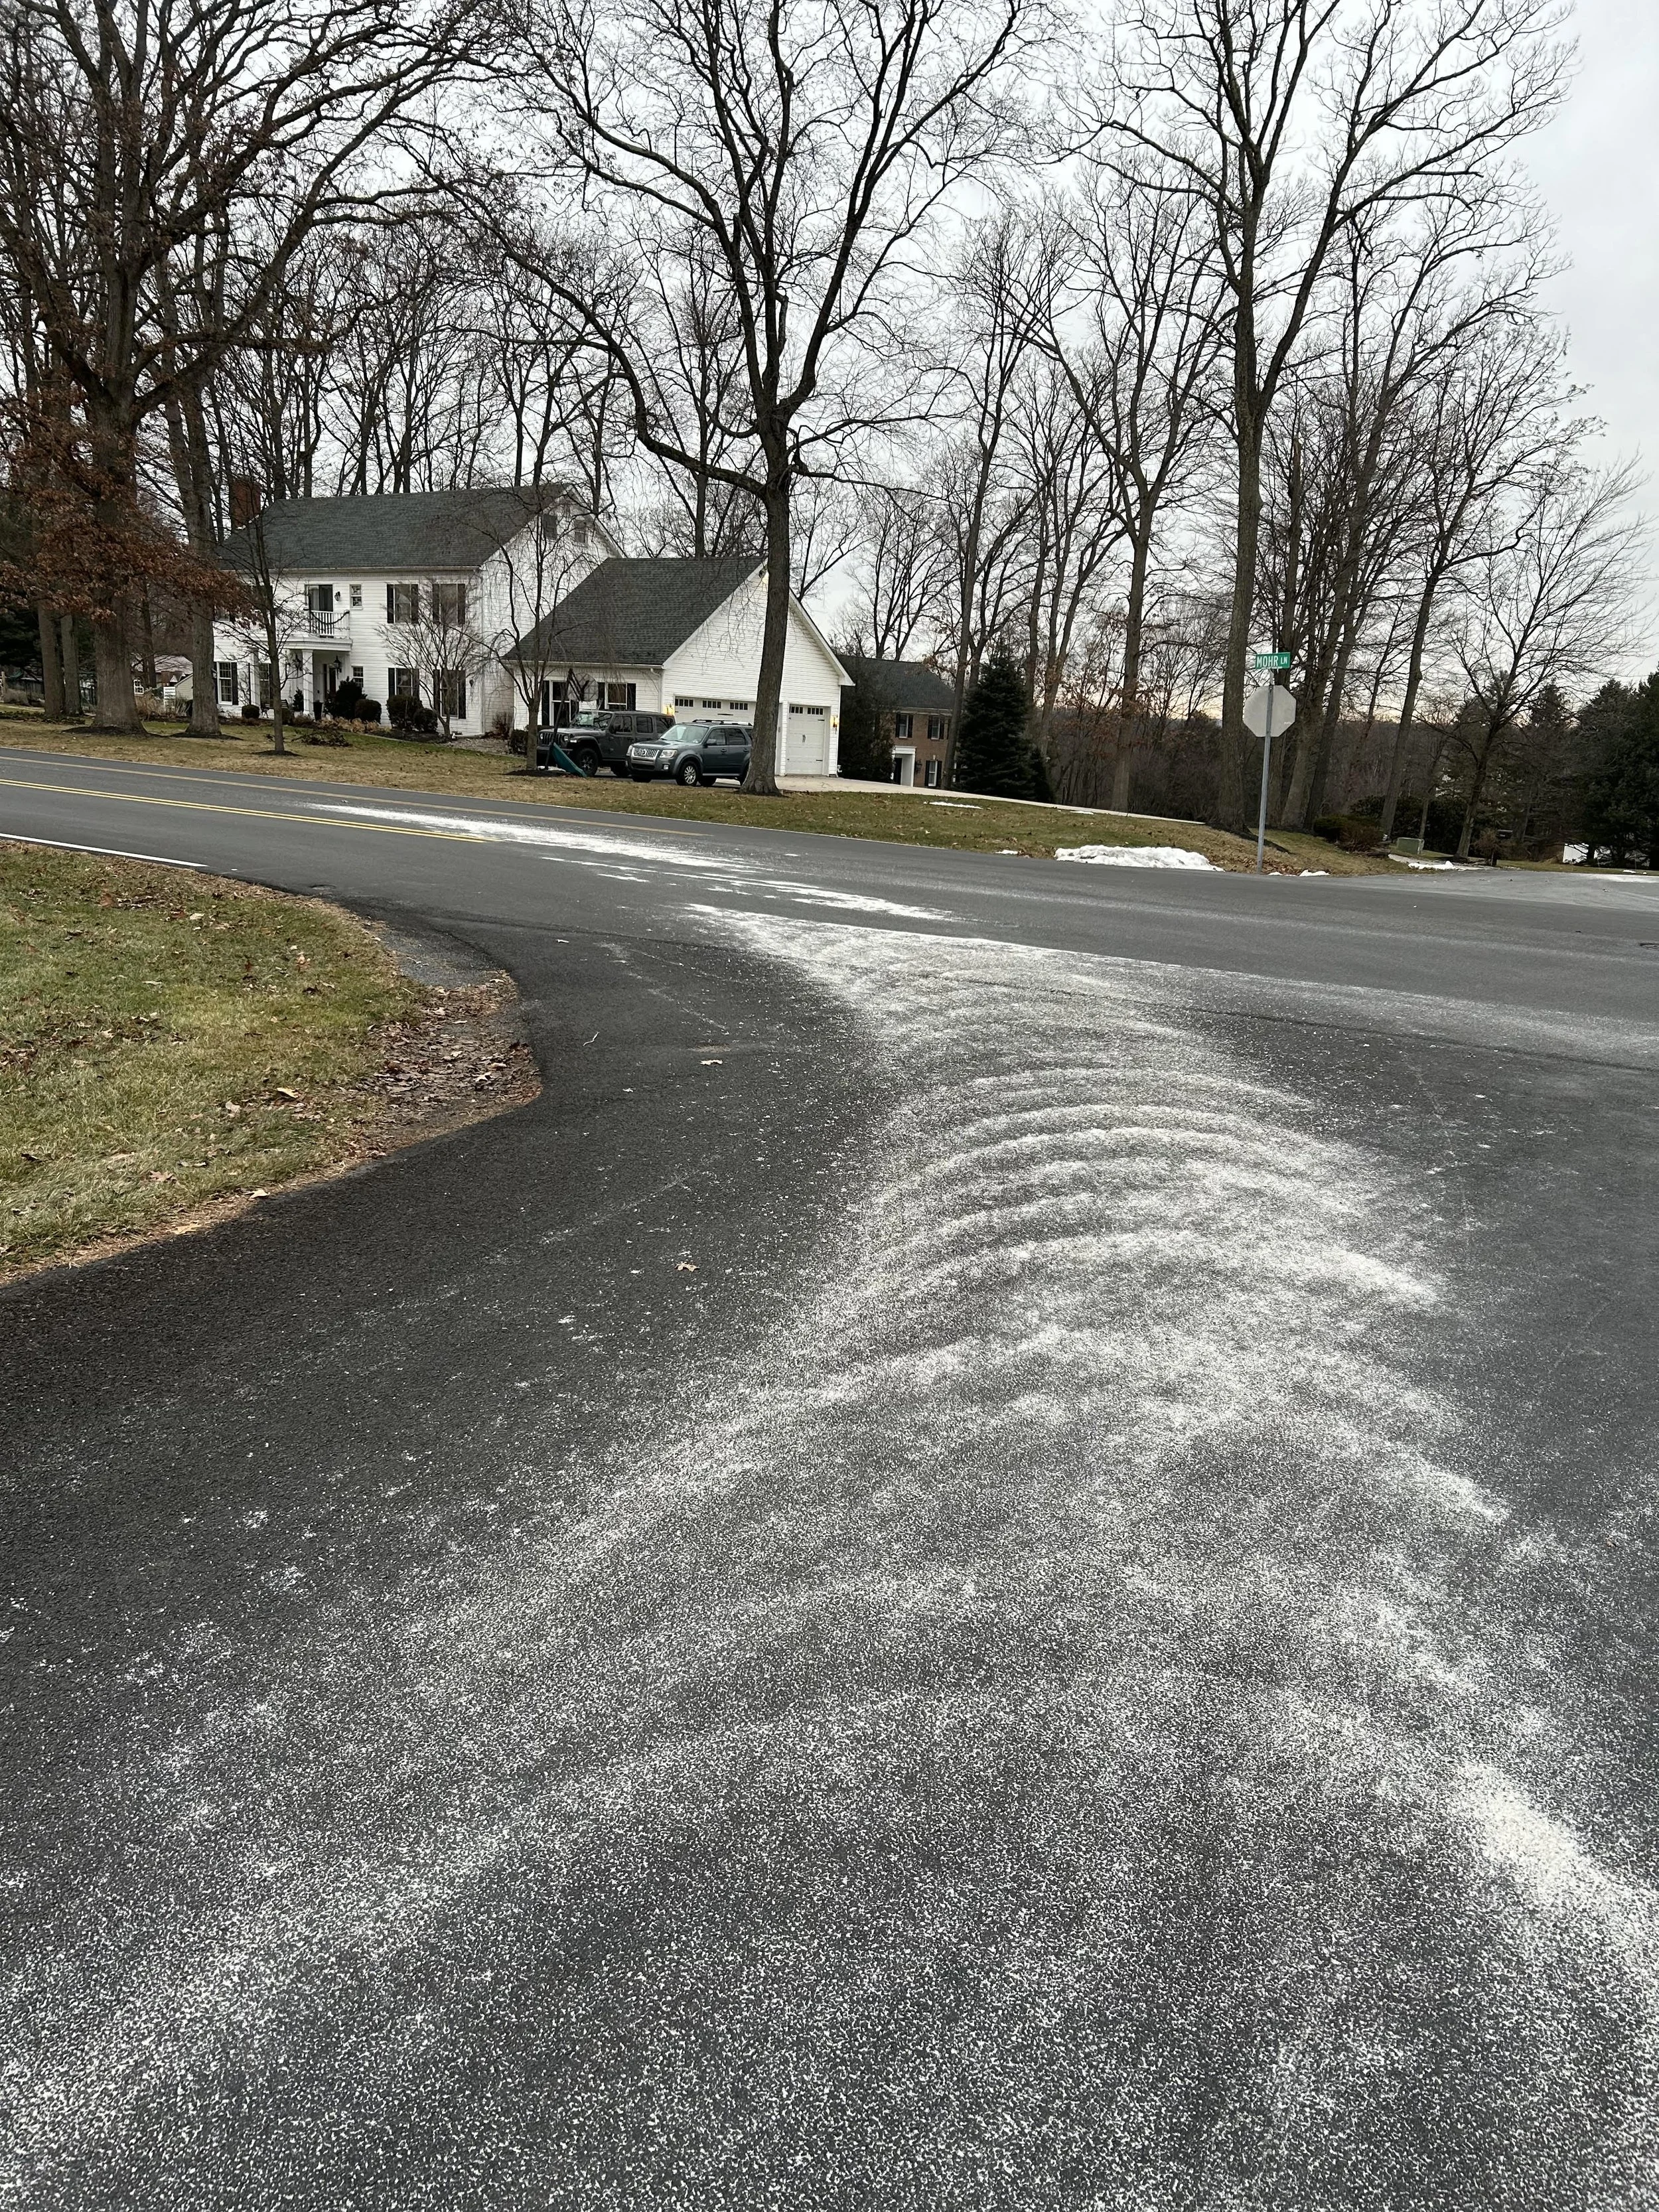
Salt pollution in our streams begins with the salt that is spread on roads and parking lots in the winter
Salt Pollution in Our Streams
What happens to all that salt they put on the roads and parking lots in the winter? It just gets washed away by the next rainstorm. Right? Well actually, no. We are becoming more and more aware that excessive use of road salt is having major environmental impacts on streams and aquifers in our region.
Why is this a problem? After road salt is applied, subsequent rain events wash some of it directly into streams as runoff. This causes large temporary spikes of salt levels as much of the salt washes downstream. The remaining salt gets washed onto the ground and then is transported down into the aquifers below.
Salty ground water is a problem for the streams in our area because they are “gaining” streams. This means that they are fed year-round, primarily by the groundwater (see image). Rain events also supply streams with water, but these only lead to temporary increases in stream level.
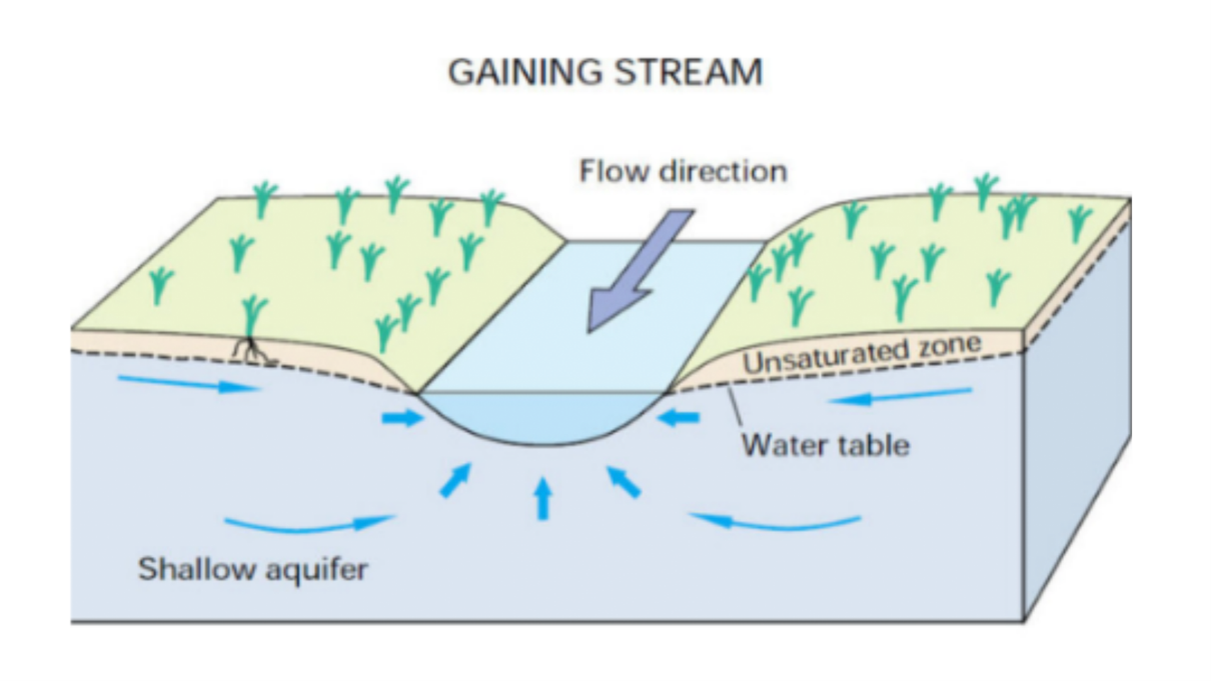
Gaining Stream Image taken from https://books.gw-project.org/groundwater-in-our-water-cycle/chapter/groundwater-connection-with-streams/
Salt Usage is Increasing - Bad News for Streams
Statistics show that the amount of salt being applied has risen exponentially over the past few decades. This is driven in part by increased development, resulting in more roads and parking lots that need de-icing. It is also caused by changing expectations about how much salt should be used and concerns over liability for slips and falls. All these factors result in excessive use of salt products, above what is necessary to efficiently clear ice.
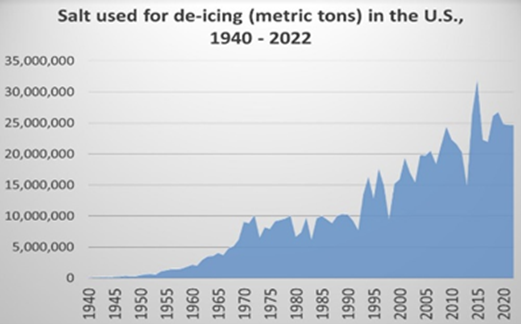
Graph courtesy of Stroud Water Research Center and Carey Institute of Ecosystem Studies. Data from USGS
LLWS Project to Measure Summer Salt Concentrations in our Streams

In 2023, LLWS became aware of excessive salt use and decided to monitor the long-term effects of salt in the Little Lehigh watershed. We conducted a “Salt Snapshot” event in August 2023. In one day we tested water from 45 sites throughout our watershed. The sampling took place in a three-hour period, when the streams were at base (low) flow. Summer sampling shows us how much salt is present year-round, because it is done at a time when the streams are only fed from groundwater aquifers.
We tested the samples for chloride and conductivity levels. What we found were levels of chloride above 50 milligrams per liter (mg/l) in 15 of the sampling sites. Locations with higher chloride levels were mainly sites in more developed areas of the watershed. Deicing products, even those labelled “safe” contain chlorides (sodium chloride (salt), magnesium chloride, etc.)
Below is link to map of the LLWS August sampling sites. Click on each site to see chloride and conductivity levels:
https://padlet.com/latzgoj/salt-snapshot-locations-98sm31sxgb1kzx6q
Summer, low flow, Chloride Levels in Little Lehigh Creek and Tributaries, 2024
The map on the right shows chloride concentrations (mg/L) in Little Lehigh Creek water as of August. Lehigh County, PA, is outlined in black. Chloride levels exceeding 30 mg/L typically indicate creeks affected year-round by winter salting. Levels above 50 mg/L are detrimental to sensitive aquatic organisms, which form the base of the creek's food web. Chloride concentrations ranged from 0 mg/L near Blue Mountain to 254 mg/L in Allentown on Trout Creek.
While levels vary, there is a noticeable trend of higher chloride concentrations with increased land development.
To find out more about the impacts of road salt:
https://www.paroadsaltaction.org/road-salt-pollution-information

What Can You Do?
First of all, be aware of the quantity of salt that you apply to your driveway and sidewalks in wintertime. You can reduce the amount you need by shoveling regularly. When you apply the salt, use about 12 ounces for a 20-foot driveway, or 10 sidewalk paving squares. Sweep up any leftover salt.
Volunteer to help combat over salting; use “contact us” button. More voices on salt are needed.
Speak up when you notice excessive salt use in your community (work, school, places of worship, shopping areas). Ask to speak to Manager or Facility Maintenance Team and voice your concerns about excess salt use. If you live in a development that uses a private contractor for winter maintenance, pay attention to how much road salt is being used, and if it appears to be excessive, bring it to the attention of your homeowners’ association. 50% of the winter salts applied in the US are used to manage parking lots, sidewalks and other commercial salting.
What Municipalities Can Do
By using best management practices, it is possible for a municipality to reduce road salt usage by 50% and save taxpayers tens of thousands of dollars in materials and labor costs. Watch the documentary “The Road Map to Road Salt Reduction” to see how this was done in New York State:
https://salt.lakegeorgeassociation.org/
What Property Managers and Business Owners Can Do
Universities/School Districts, Hospitals, Churches, Business owners, and other large land owners that contract winter maintenance can craft contracts requiring winter maintenance professionals to use Best Management Practices such as calibrating equipment, training workers, and using minimum salting guidelines. See top of page “Property Manger Resources” information for good resources. Watch the one hour training video on Contracting with Road Salt Applicators.
https://www.youtube.com/watch?v=8cjHmcMZGt4
To find out more about the impacts of road salt, what can be done and resources for advocacy visit PA Road Salt Action Website at:
https://www.paroadsaltaction.org/road-salt-pollution-information